The Difference Between Marginal And Effective Tax Rates
The answer to the question “What tax bracket am I in?” is not as straightforward as it appears. Usually, an individual’s federal tax rate is a blend of different rates that depends on factors such as their filing status and income.
Each year, the IRS publishes a series of charts outlining the various federal tax rates at different income levels. The charts are progressive in nature (meaning that you pay more as your income increases). While there are some exceptions to this at lower income levels, this means that you normally don’t pay the same amount of tax for every dollar of earnings. How you manage your income, when possible, can greatly impact your federal tax bill.
People often misconstrue their “tax bracket” to equate to how much tax they need to pay on their income. Instead, the tax they pay is usually a blended rate of different income levels, also known as the effective tax rate. The answer to the initial question, most likely, is trying to determine instead, “What marginal tax rate are you paying on your last dollar of income?”
Marginal Tax Rate Tables
For illustrative purposes, the charts below show a summary of the 2022 marginal tax rates for both “Single” and “Married Filing Jointly” filers. That is, these are the rates for the 2022 taxes that are due in April 2023. Your tax bracket depends on your filing status and your income level. The entire IRS publication of federal tax rates can be found here.
Chart 1: 2022 Marginal Tax Rates For “Single” Filers
The chart below shows the seven tax brackets for single filers for the 2022 tax year.
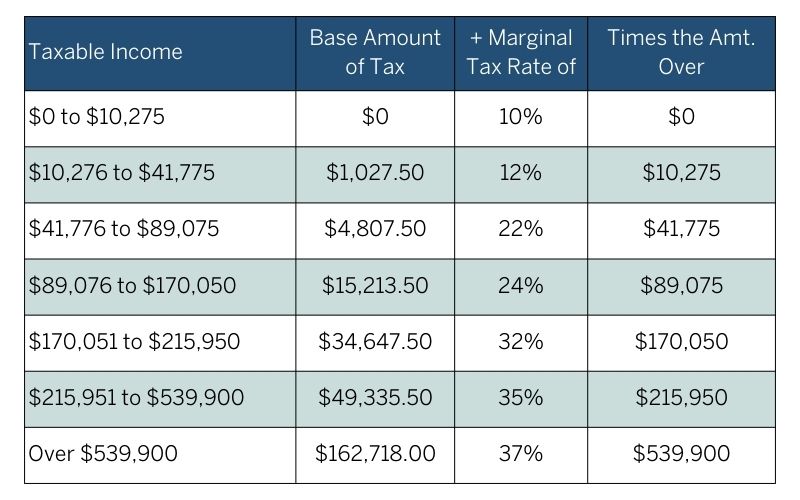
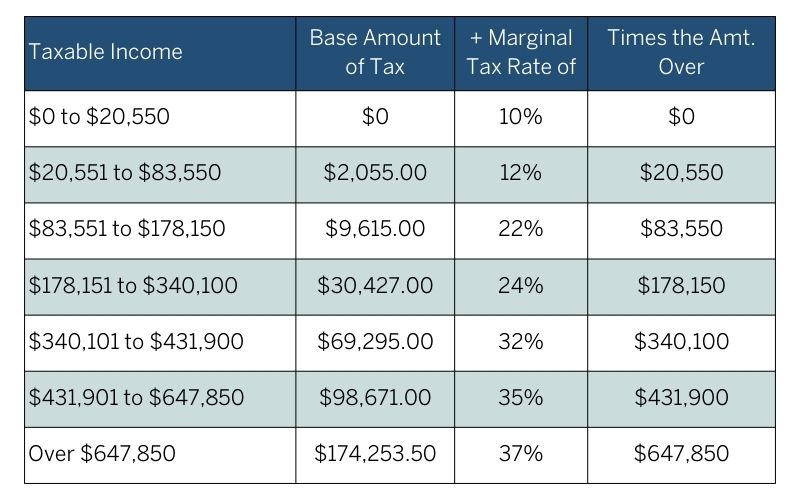
Chart 2: 2022 Marginal Tax Rates For “Married, Filing Jointly” Filers
The chart below shows the seven tax brackets for those married, filing joinly for the 2022 tax year.
Single Filer Example
Referencing “Chart 1” for a single filer, let’s look at a simplified example to highlight the difference between the marginal tax rate and the effective tax rate:
Amy has a wage income in 2022 totaling $40,000. She does not itemize her deductions, so she takes the standard deduction of $12,950 for the 2022 tax year. Not considering any other tax factors (such as credits, other sources of income, carry-forward losses, etc.), here is a breakdown of Amy’s tax calculation:
- Income of $40,000, less a standard deduction of $12,950 (2022, Single Filer) yields a taxable income of $27,050
- This puts Amy in the second row of income ($10,276 to $41,775) on the “Single” chart above
- Reading across that row, the first $10,275 of this income is taxed at 10%, yielding $1,027.50 in tax for this portion of her taxable income
- Then, the next $16,775 of income (the amount over $10,275 to get to her taxable income of $27,050 is taxed at 12%, yielding an additional $2,013.00 in tax
- Amy’s total tax due is $3,040.50
Amy’s marginal tax rate, or the rate at which her next dollar of income would be taxed, is 12%. However, Amy’s effective tax rate is calculated as her total tax due ($3,040.50) divided by her total income ($40,000), or 7.6%.

Married Filing Jointly Example
Let’s look at a second example. Sara and John are married, filing jointly, and have a combined total of $200,000 in wages. They itemize and have a total of $28,000 in deductions.
- Total income of $200,000, less itemized deductions of $28,000, yields a taxable income of $172,000
- This puts Sara and John in the third range of income ($83,551 to $178,150) on “Chart 2” above
- Reading across that row, the base amount of tax is $9,615.00 (this is calculated as a combination of the marginal taxes calculated at the lower 10% and 12% brackets)
- Then, the remaining $88,450 in taxable income (the amount over $83,550 and up to their taxable income of $172,000) is taxed at 22%, yielding another $19,459.00 in tax
- Sara and John’s total tax due is $29,074.00
Sara and John’s marginal tax rate, or the rate at which their next dollar of income would be taxed, is 22%. Their effective tax rate is 14.53%, calculated as the total tax due ($19,459.00) divided by their total income ($200,000).

Conclusion
From the examples, you can see how the marginal tax rate can be quite different from the effective tax rate. Understanding how these rates differ and how they change at different income levels is key for smart financial planning. There are some important characteristics of these marginal tax tables and a household’s situation that need to be considered from a financial planning perspective, as there could be opportunities to manage income and deductions in certain years to reduce tax liability.
The examples above are simplified to illustrate the calculation of how marginal tax is applied. Each individual household’s circumstances will be different. Please consult a CPA or certified tax professional to evaluate and provide guidance for your situation.
In an upcoming series of articles, I will cover some interesting characteristics of the tax tables, including the absolute and relative differences that exist between the various tax breakpoints. Then, based on these variations, I will outline some specific conditions that showcase how the navigation and management of these marginal tax rates becomes very important. If you haven’t already, sign up to receive our email updates and be the first to know when new articles are published.
Disclaimer:
Expressions of opinion are as of this date and are subject to change without notice. Any information provided is not a complete summary or statement of all available data necessary for making an investment decision and does not constitute a recommendation to buy, hold, or sell any security. There are limitations associated with the use of any method of securities analysis. The information has been obtained from sources considered to be reliable, but we do not guarantee that the foregoing material is accurate or complete. Every investor’s situation is unique, and you should consider your investment goals, risk tolerance, and time horizon before making any investment. Prior to making an investment decision, please consult with your financial advisor about your individual situation. Past performance does not guarantee future results. Investing involves risk, and you may incur a profit or loss regardless of strategy selected. There is no guarantee that any statements, opinions, or forecasts provided herein will prove to be correct. Dividends are not guaranteed and must be approved by the company Board of Directors. Indices are included for informational purposes only; investors cannot invest directly in any index. Please note, changes in tax laws or regulations may occur at any time and could substantially impact your situation. While we are familiar with the tax provisions of the issues presented herein, as Financial Advisors of Blue Chip Partners, Inc. we are not qualified to render advice on tax or legal matters. You should discuss any tax or legal matters with the appropriate professional.